The landslide is one of the most closely measured pieces of ground in America. Here's what the instruments say — and where to see the maps yourself.
| Area | Rate | Trend | Notes |
|---|---|---|---|
| Active complex overall | 0.99 in/week average | ▼ 9.8% since July — first time under 1 in/week since October 2023 | Average across areas still moving inside the active boundary |
| Portuguese Bend Landslide | 0.81 in/week | ▼ 13.9% since July; down 92% since the wells began | Largest slide; ~74% of its historical boundary now moves under 1 in/week |
| Abalone Cove Landslide | 1.29 in/week | ▼ 7.7% since July | Fastest-moving remaining area; ACLAD wells plus new city wells |
| Klondike Canyon Landslide | No measurable movement | — generally none in recent surveys | KCLAD wells and drainage; beneath the Seaview area's edge |
| Seaview | No measurable movement | — stable since early 2026 | Gas restoration underway for homes that request it |
| Portuguese Bend Beach Club | No measurable movement | — stable since early 2026 | Movement drastically slowed since October 2024 |
| City of Rolling Hills (edge) | ≤ 0.1 in/week | — minimal | Fringe of the complex within the neighboring city |
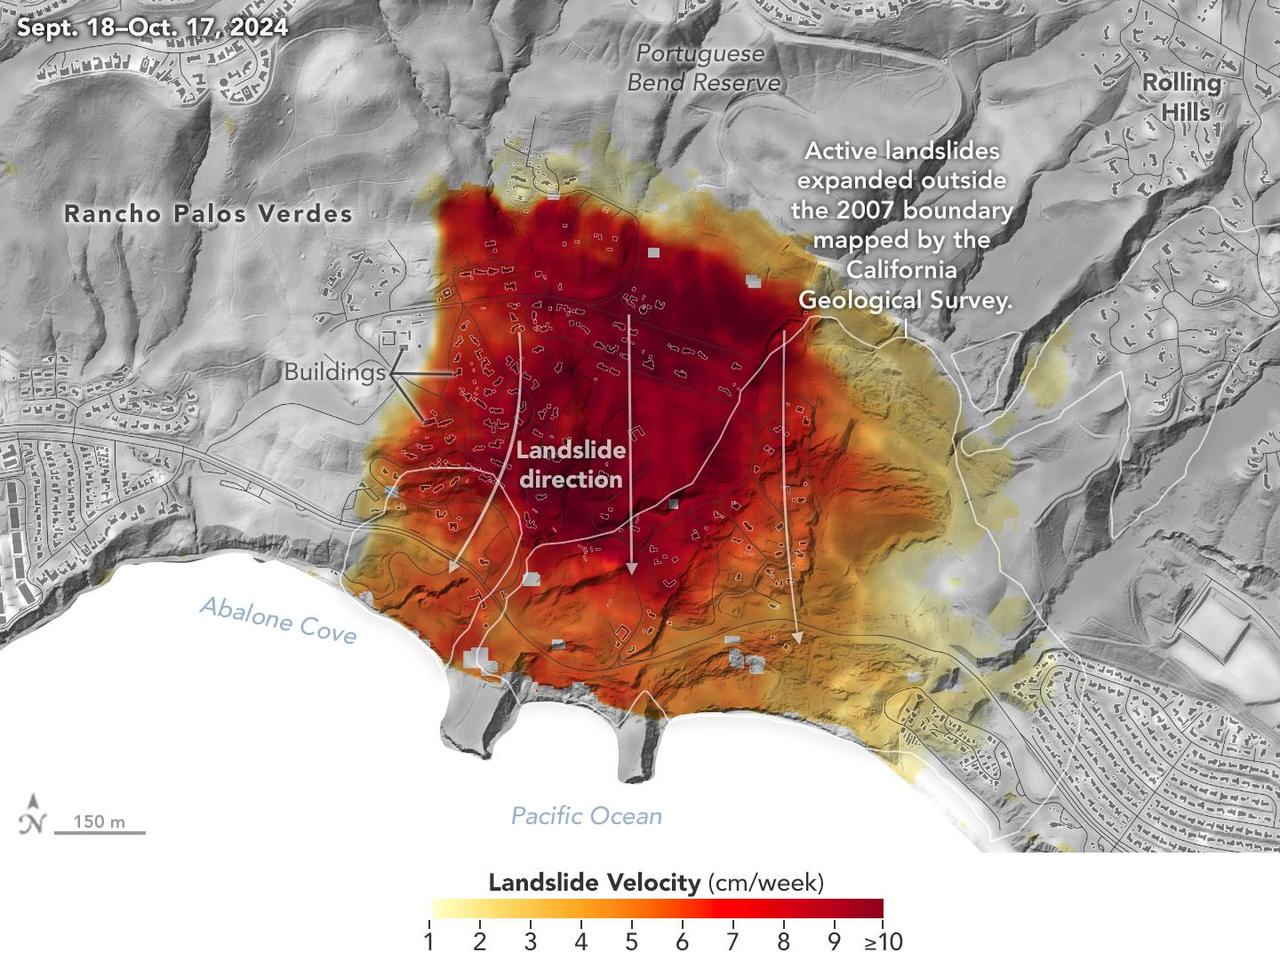
For perspective: at the fall 2024 peak, NASA/JPL radar measured up to ~4 inches per week in residential areas — and parts of the interior complex moved faster still. Rates are updated as new survey data is released; see Latest Updates.
On the ground: even where rates are low, the terrain itself is altered — roughly 16 miles of trails in the Portuguese Bend Reserve are damaged, with dozens closed and full restoration considered unlikely. Check the City's trail conditions page before hiking, and treat ground near fissures as unstable even when it looks solid.
A schematic overview of the Greater Portuguese Bend Landslide Complex — the four active slides, the ancient boundary, dewatering wells, the 2024 utility-shutoff neighborhoods (which are also where the buyout homes are located), and key landmarks.
About this map: Schematic and approximate — drawn for orientation, not for parcel- or survey-level decisions. Slide outlines generalize California Geological Survey mapping (2007 boundaries; the active area expanded beyond them during 2024). Well positions indicate general locations of the City's deep dewatering wells at the Portuguese Bend toe and district wells, not exact coordinates. For authoritative maps, see the City's survey maps and NASA/JPL radar imagery.
The City, FEMA, and Cal OES do not publish the addresses of homes selected for the Voluntary Property Buyout Program, to protect applicants' privacy. What is public: 85 eligible applications were received; 22 homes were selected in Round 1 ($42M) and 5 more in Round 2 ($10.16M) — 27 so far — and a Round 3 application ($19M, roughly 8 more homes) awaits FEMA's decision. The participating properties lie within the Greater Portuguese Bend landslide area — principally the Portuguese Bend and Seaview communities hatched on the map above. Separately, FEMA's July 2026 Cumulative Final Public Notice (as posted by the City) describes a broader proposal to acquire and demolish up to 45 residential properties across Portuguese Bend, Seaview, and the Beach Club as part of the overall mitigation package — a proposed total, distinct from the homes currently selected. We deliberately do not attempt to identify individual homes.
The City's contractors survey a dense network of GPS monuments across the complex, producing the periodic movement reports quoted everywhere (including here). This is the authoritative rate dataset, published via the City's Landslide Surveys and Land Movement Updates pages.
City survey updates →JPL's UAVSAR instrument, flown on a Gulfstream III, mapped the slide's full extent, speed, and direction during the 2024 peak — independently confirming the City's ground measurements and revealing movement beyond the 2007 mapped boundary toward Abalone Cove.
JPL analysis & imagery →The California Geological Survey mapped the active slides (Portuguese Bend, Abalone Cove, Klondike) inset within the ancient complex; its 2007 boundaries remain the standard reference, with the active area expanding beyond them during 2024.
California Geological Survey →Dewatering well output is itself a dataset: about 566 million gallons pumped as of September 2026 from the slide since fall 2024, with production tracked well-by-well in Working Group notes and Council staff reports. Falling groundwater is the mechanism behind the slowdown.
Where to find well data →Inches per week is the standard unit here. For scale: 1 inch/week is about 4.3 feet per year — slow enough to walk on, fast enough to tear apart pipes, pavement, and foundations. At the 2024 peak, parts of the slide were moving at rates better measured in feet per month.
Movement is not uniform. The complex behaves like several conveyor belts of different speeds: the coastal margins have largely stopped, while interior sections of Portuguese Bend and Abalone Cove still creep. A single "average" always hides faster and slower spots — which is why per-area rates matter.
Rain is the driver. Movement historically surges one to two seasons after wet winters as water works into the deep clay layers, and eases after dry stretches and sustained pumping. The 2025–26 slowdown despite above-average rain is the strongest evidence yet that dewatering is working.
The NASA radar speed map is displayed right on this page; the interactive tools are a click away with instructions:
The authoritative maps of the landslide. NASA's radar speed map is hosted right here; the interactive government tools open in their own sites, with instructions for finding the landslide data once you're there.